|
Heres my Before doing my desmos reflection i didn't honestly think I was realistically going to get it done or even be able to do it. Looking at all the previous class’s projects was quite daunting just because my experience with desmos was entirely limited to the small activities we’d done in class together. I put off starting my desmos project for quite a few weeks, not exactly stressing about it so much as avoiding thinking about the project entirely. Eventually though, I did start it. The first couple times I did it were definitely rough, I seemed to have a problem remembering to save my progress which wasn’t ideal. After a few days of starting and not getting much done I slowly became better at getting the lines where I wanted them faster and with less painful deliberating over decimals. By the end of the project I knew what formulas to use for different types of lines and how to get the lines done efficiently. As a result of this project I definitely became a lot more sure of equations, which I wasn’t really expecting to be honest. My advice to anyone starting this project would be to find a very symmetrical image because it will make your life drastically easier and the thicker the lines the easier it is to match them. Here's my project https://www.desmos.com/calculator/smxnzxegju
0 Comments
https://www.desmos.com/calculator/bcqsrobfw1
Hi guys. I chose a symbol from the book six of crows (if you haven't read it you should, it's really good) for my demos project. I think it was a good choice, because although I only used linear equations, I found that the finished product was sufficiently complicated to look good. I liked not having to worry about how it would look in demos, because it was just a silhouette, so there weren't any 3 dimensional aspects. I think that made it much easier. I mainly used slope intercept form when graphing, because I found it easiest. If I had to do it again though, I would probably use some other forms to make sure I really understood them. I'm most proud of the back wing and tail feathers, because they required a lot of time and effort to get right. Since I only used linear equations, I found that part the trickiest because they were in no way straight. If I had more time, I probably would have experimented with some curves, but I'm happy with what I got nonetheless. I also would have liked to finish the whole image, but I unfortunately, I don't have that kind of work ethic :) What's up y'all?
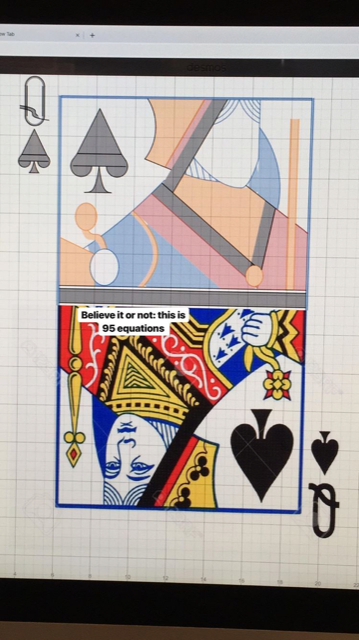
For my desmos project I chose baby groot from guardians of the galaxy because he's cute and I thought he'd be simple enough to draw. Unfortunately I didn't chose a very high resolution image so I had to approximate a bunch of the lines, but I am proud of the end result and I think he bears some resemblance to the original drawing. If I had had more time I would've used a bit more parabolas, and experimented with some shading. At first I really struggled with linear equations but with some help from my friends and lots of practice I found I now understand slope intercept formulas quite well. I thought this was a really cool project because I found it really useful to be able to visually see when our equations make sense. Learning through a visual guide of linear equations has changed the way I see them and improved my learning. One thing in particular I took away from this project was where negative numbers fit into equations. Often when writing an equation i'd get the y-intercept off because i'd be doing the decimal of a negative number as if it were positive instead of counting backward. That was a small piece of this project but it definitely helped me envision negative numbers better. lrxq3m2ilk Hi guys, sorry for the late post :) On Friday we learned about sine (sin), cosine (cos), and tangent (tan). So let's start. What are the names of the different sides of the triangle? The hypotenuse, the opposite, and the adjacent. The hypotenuse is always the side directly opposite of the right angle. If one of the acute angles is theta (idk how to put the symbol in here), than you can identify the opposite, which is across from theta. The side that is left over is the adjacent (the one beside theta). For example: 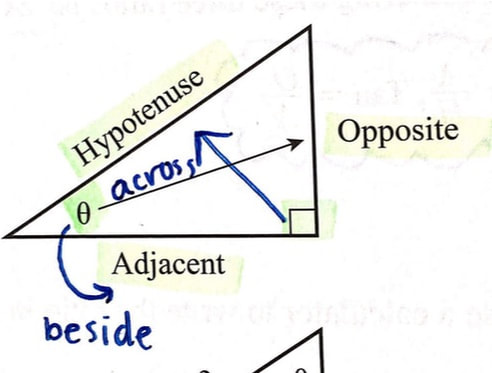 Trigonometric Rations are sine theta = opposite / hypotenuse, cosine theta = adjacent / hypotenuse, and tangent theta = opposite / adjacent. The way we remember this is SOHCAHTOA. Remember that? So to find sine 35°, just press the "sin" button on your calculator and then put in 35. The number you get is your answer. It's that easy. For now. Remember, the hypotenuse (hyp), opposite (opp), and adjacent (adj) on your triangle can change, based on which angle you choose to base your labeling from. When you KNOW the angle, use sin, cos, and tan. But when you need TO FIND the angle, use sin^-1, cos^-1, and tan^-1. That's pretty much it. Lucy Link: https://www.desmos.com/calculator/4roqe75cz3
I was surprised by how beautiful the final product was, i was also surprised by how simple making the desmos art was, to be honest i though it was going to be difficult with all the straight line approximations and all that. I'm proud of this thing, especially the chin, it took me the longest, and i think it looks the best out of the entire thing. y=mx+b was the most important part of this, it's most of the project apart from a few parabolas here ad there. I'm glad i didn't obsess about the lines being perfectly aligned each time, i think that it looks great and that sometimes the non-perfect symmetry adds to its charm. At first, the parabola formula confused me but it made more and more sense to me as i wet along. I chose graphing peter kirby griffin because i wanted a challenge and it looked good The hardest part of the project was the straight line approximations that i needed in order to create the body and the arms My understanding of all of the equations i used vastly increased, and can now recognize slope formulas just by looking at them, along with parabola formulas. Hello again all, Johnathan here today to explain the addition method, aka the elimination method for solving linear systems. This method is a neat and useful method for solving linear systems which I will do my best to summarize for you now. The first step to the addition/elimination method is to ensure that your equations are all in standard form, ax+by=c. The next step is to make it so that either the x or the y value in each equation have the same coefficient but opposite signs. If this is not already the case, you can multiply all numbers in one (or both) of the equations by a number that will make it happen. Once you’ve done this, the variables which now have the same coefficient and opposite signs can be crossed out and are no longer a part of the equation. Once these variables are crossed out, add together the remaining parts of both equations. But why does this work? Let’s look at a quick example: Say we have a system of equations which has already been put through step 2: 3x-2y= 5 -1(3x+y= 11) ⇾ -3x-y= -11 If we cross out the x variables which now have the same coefficient and opposite signs, we can then add the equation and solve. (-2y= 5) (-y= -11) (-2y-y)= (5-11) ⇾ -3y= -6 Another way this could be visualized is if we bring back the previously removed variables: 3x-2y= 5 -3x-y= -11 (3x-3x)+(-2y-y)= (5-11) ⇾ -3y= -6 As you can see, the x variables cancel each other out once again, in total equaling 0. Ensuring that these variables cancel out is what allows us to solve for the other variable. Either way, this limits the equation to only one variable, thus allowing us to solve for it. -3y(÷3)= (-6÷-3) y= 2 Now that you know the value of y, you can take one of the original equations and substitute the y variable for its value and thus find x, and there you have it: the elusive and beautiful Correct Answer. Hopefully. If you’d like to make sure your answer is correct, you can now substitute both values into the other original equation to make sure the math checks out. If this does not break any fundamental laws of mathematics, the math checks out and you're good. If this does break math or is 0 = 0, see below. IMPORTANT THINGS:
Hey y'all, so today, I (kiran) am going to be explaining how to a) solve a linear system by graphing and b) giving you a vocab toolkit to do so in this workbook. (Before we begin: This is my second time 'round as I accidentally deleted half of my post, so forgive me for its poor quality) To start, a system of linear equations is a set of 2 or more linear equations. (Never could of guessed) For example, 4x + y = 8, and x + 3y = 7 . In grade 10 we will only be dealing with 2 equations, so lucky us! We graph linear equations to get a visual representation of the problem so we can find the solution. (or absence of one) Let me explain: there are 3 types of solutions to a linear system. One solution, no solution, or infinite solutions. These essentially describe what we are seeing on the graph and in an equation. Here's more info below: One solution: When graphed, these two linear equations are perpendicular to each other. They only intersect at 1 point, and only ever 1 point, so they only have one shared x and y value. This gives them only one point in common which is the one solution. It is a consistent (has a solution) system of independent equations. (Independent because the two equations are completely different except for their one shared point. They do not rely on each other) No solutions: When graphed, these two linear equations are parallel to each other. They never intersect, and have no shared x and y value. This means that there is no solution. It is an inconsistent (does not have a solution) system of independent equations. Infinite solutions: When graphed, these two linear equations are literally the same line. There are an infinite number of solutions because both lines share every single x and y value. It is a consistent (has a solution) system of dependent equations. (Dependent because the two equations are the same: they rely on each other) Ok so now we know to identify the number of solutions based on a graph, but now we actually have to graph these 2 linear equations. Here's how: 1. If the equations aren't in slope-intercept ( y - y₁ = m(x - x₁)) or standard form (Ax + By = C) turn them into those 2 forms. 2. Graph them on the same grid 3. Find the intersect point of the two lines. (or don't if the two lines are the same - infinite solutions) The solution = the ordered pair (Eg. (4, 2)) of the intersect point 4. Put the ordered pair into the equation ( replace the x with the 1st number and the y with the 2nd of the ordered pair) 5. Label the intersect point (Ie. the solution) Here are some things to remember when graphing these linear systems: - Simplify your equation before starting (if you can) - With no solutions (a parallel line) the linear systems will have the same slope, but a different y-intercept - Different slopes will almost always have different y-intercepts - Infinite solution linear systems seem easy to identify, but they often do not look like the same linear equation until you solve each one. (Basically just don't guess, solve.) Anyways, I hope that made at least a little sense to you. If not, whoops. Sorry. Here's a video that includes all the options of solutions, but only solves for 1 (no solution):
Hey, Younes here in class today we have learned about function notation, which is f(x) . To put it simply, f(x) is equivalent to what we used to write as “y”, also it isn’t f multiplied by x but f of x. Ex: f(x)=mx +b is the same thing as y= mx + b. Something to remember is that once you put a number in the f(x) position, it implies the value of y depending on what x is. For example a notation, f(3) shows the value of “y” when x=3. |
Find your green dot!AuthorsWe are members of Esquimalt High School's Gifted Math 10 class. Most of us like Hi-Chews. Archives
June 2019
Categories
All
|

 RSS Feed
Photo used under Creative Commons from Free Public Domain Illustrations by rawpixel
