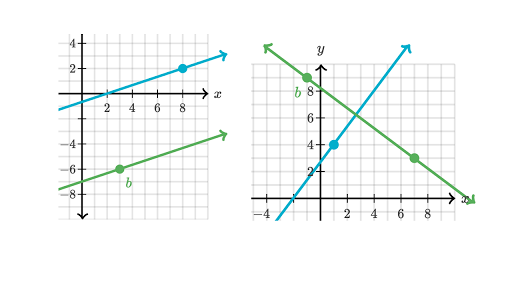
 Hi today i'l be explaining Parallel and perpendicular lines. Parallel lines are lines in a coordinate system that never intersect. Because they rise and fall at the same rate, they have the same slopes. The image on the left is a example of this. Perpendicular lines are lines that form right angles with each other when they intersect. The product of the slopes of perpendicular lines is always -1. Another way to tell if two lines are perpendicular: if the slope of one is a/b, then the slope f the other line will be -b/a. The image on the right is an example of this. If you have on line, to find its perpendicular other line, all that must be done is to find its reciprocal, then make that a negative. for example, 2, and -1/2 and perpendicular to each other. -Ben T.
0 Comments
hey theydies! your local soup lover here today to summarize how to graph linear equations xx there are three main ways to solve/graph linear functions: by creating a graph or using the slope formula (the x points subtracted over the y points subtracted, y'all know what I mean I just don't know how to put that formula in here lol I'm inept at computers). With the slope formula, you are able to find the slope of the line with two given points or find a second point in a line when provided with the slope and a singular point. when you use the actual grid method, you create the grid, plot the point provided (if you're lucky enough to know one) and then follow the slope formula, rise over run, to create your slope triangle. once you have that second plotted point, you can connect the two points with a line, add some arrows and !! u got yourself a line wowie the formula option is arguably faster and according to mrs bjornson, you wanna have this one down pat for senior math classes! with this one, you put your x's above your y's, subtract 'em, and then bam!! your slope!! also! don't forget that if your slope has a negative sign at the centre of the fraction, just assign it to either the numerator or the denominator. it doesn't matter which one! isn't that nice for once. another time its easy to determine the slope is when you're given an x and y intercept! using this information, you can use your preferred method to find the slope. also remember that if your slope is undefined, its just a vertical line! and if your slope is 0, its just a horizontal line! sneaky aren't they now. heres someone summarizing everything I just attempted to explain but doing it significantly better: thanks for reading and I hope I didn't do too terrible of a job!!
xoxo Caitlin So apparently this didnt post the first time. YAY. A non-linear equation is an equation (y = x+2) that is not a line (its not straight). What this means is that the equation is to a degree THAT IS NOT ONE. Pretty much. If it has a degree or 2, it will make a parabola; if it has a degree of 3 it will be a fat fat S. The higher the degree the fatter it will get. There are some tips I have for you to not screw up graphing non-linear equations: - use as many integers as possible - if the value is to an even power (y = x^16) use both positive and negative values - use values between 0-1 when the x is in the denominator or the exponent (y = 5/x or y = 5^x) - use enough points to understand what's going on A very common question you will find is 'is this a function?'. you have a 50% chance of guessing right so do your best. ok but actually just graph it out and do a verticle line test (fun fact: if the y is to an even power it's not a function.) :) here's some fun videos:: https://www.youtube.com/watch?v=CYBKdCvwCQI you're welcome sofia
before we get into let me just say that I was originally written to do chapter 3.3 but because I missed that lesson i switched with Sofia and covered 3.4. fun news, she forgot. so now we have two of these and none of those. good luck. Graphing Non-Linear Equations because thats all the chapter is about:REMEMBER WHEN GRAPHING THEM TO USE A WIDE RANGE OF INPUTS Basically, just make a table chart thing and chose some values. Is it a function? Guess. Or don't I really don’t care. Just graph it a v-line it and then yeah that's basically it. FUN HINT if y is to an even power its not a function because there's gonna be multiple potential y values for every x. Examples: x = y2 Because y is the one with the fanciness we’re gonna pump some values into that. Let's use -2, -1, 0, 1, and 2, because they’re useful and its what the textbook shows. 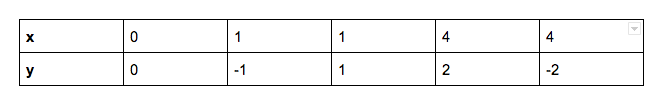 And that makes a fun thing that kinda looks like this: 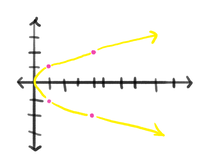 Which ain’t a function because it double v What about y = x2 - 1? Well it’s the x with the fancy dancy so lets do them first. 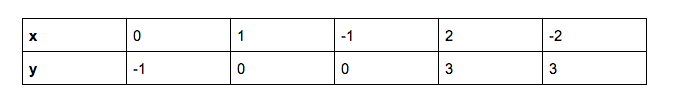 Which does a this: 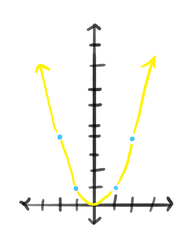 And, fun fact, its a function Last example: x2 + y2 = 9 So for this one ya just kinda need to understand but im not too sure how testy this will be. SO because both x and y are to even powers they both could be positive or negative. Basically you algerebra it and stuff but thats not shown in the book so imma not. The table is there buts it's confusing so instead heres just the graph 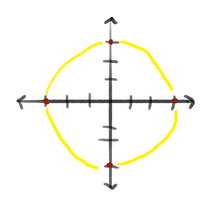 Its a cricle! Why? Well, remember when just x was squared and it created a half-circle curve and when just y was squared it made another half-circle curve but the other way? Well this basically closes the circle by overlaying the stuff. Cool. Also its not a function. Voila. And now I shall depart and curse my sister for our terrible communication. I really dont want to do another of these. Astrid ps heres a digitalized version of what i drew on my notes  Alright so today we're learning how to find the rate of change in graphs. What fun. The rate of change is a ratio used to compare quantities with different units of measurement. Our best friend with us today is the formula that we use to calculate rate of change, y₂-y₁ /x₂-x₁ 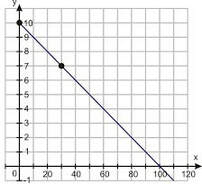 Lets use this graph on the left as an example. y will represent the temperature in degrees Celsius (°C) and x will represent the rate of the temperature dropping over time (minutes). Our first step is to find the values of Δy and Δx. The rule is that y₂ always has a higher value on the graph than y₁ but x₂ has a lower value than x₁. You can choose which points you want to measure from for y and x as long as you don't change them. Remember the units! y₂ = 10°C y₁ = 7°C x₂ = 0 minutes x₁ = 30 minutes So now our formula turns into, (10 - 7) ÷ (0 - 30), which is equal to 3°C/-30 minutes. Convert fractions or decimals into integers when possible. The rate of change for this graph is -0.1°C/minute, -1°C/10 minutes or -6°C/hour Post made by Ethan Hello! This is Rebecca's post Hello there! Johnathan here today to explain the fun concept of functions. Let's jump right into it, shall we? A function is, simply put, a relationship with an input x value which is then changed into an output y value. Input (x)➝function (f)➝output (y) Therefore, the output y is equal to the input x value after being put through the function. This is commonly written as y = f(x). Each domain (x) value in a function is related to a single range (y) value; however, a y value can have multiple x values in a relationship with it. Like polygamy. For example: (2,3), (4,5) is a function, because each set has a unique domain (x) value. (2,3), (2,5) is not a function, because the domain (x) value is repeated. (2,3), (4,3) is a function, because each set has a unique domain value. The range (y) value is repeated, but this does not affect it being a function. To determine if a graphed relation is a function, use VLT, Vertical Line Test! Using this revolutionary product, place a vertical line anywhere over the graph. Then, sweep across the graph to see if the vertical line ever intersects the relation in more than one place at any point. If not, congrats, you have a function. Functions where each x has a single y and each y has a single x are called One-to-One functions, but these are irrelevant to our class and not on the test. Just thought I'd add it in case anyone was curious. It is also possible to alter non-function relations slightly so they become functions. As Mrs. Bjornson said, If you get gum in your hair, you can be like, “okay, I’m just gonna live with gum in my hair”, or you can be like, “I’m gonna cut it out!”. And that's about it. The first video below explains how to tell if an ordered pair relation is a function, and the second demonstrates how to use the vertical line test. The guy's vertical lines are pretty bad in my humble opinion. But before I go: why did no one like the lone domain value? Because it was de-ranged. I'll see myself out.
|
Find your green dot!AuthorsWe are members of Esquimalt High School's Gifted Math 10 class. Most of us like Hi-Chews. Archives
June 2019
Categories
All
|
 RSS Feed
Photo used under Creative Commons from Free Public Domain Illustrations by rawpixel
