|
Hello all, Annabelle here. Today our lesson was on linear applications and modelling, which is basically a fancy way of saying how to use graphs to figure out day to day problems. These would most commonly be shown as word problems and learning how to convert the information into graphs is an important concept and one that involves lots of factors. Something to consider when analyzing data to try and graph it is, "how do we decide which one is x and which one is y?" You can figure this out by asking yourself, what are the variables, and which one is dependent? The dependant variable =the y-axis and the independent variable=the x-axis. Some vocabulary to know is slope = rate of change which we all probably know already, but the units for that in word problems can be shown as 'per.' Though it can sometimes be more intuition rather than exact steps, here some rough guidelines to follow when turning word problems into graphs. 1) figure out what the question is asking. What forms are your equations supposed to be in, what information do you have and what information do you need. 2) figure out variables. what represents x and what represents y? 3) form equation based on information, this could mean calculating the slope. Again, check to see which form your equation should be in. * 4) graph *side note: you may have to do algebra to convert one form of linear equation to another. If you're struggling, i'd highly recommend watching videos on how to do this, they usually explain things step by step and I find it very helpful. Happy graphing!
0 Comments
Holla holla guys, gals, and non-binary pals, today we're having a hoot and a holler, a true banger if you will, today we will be discussing equations of parallel and perpendicular lines as well as how to manipulate them and represent them on graphs. As you will remember from previous lessons, the slope of an equation is what must be manipulated to make lines parallel or perpendicular to each other. The difference this time is that instead of using lines on a graph, we'll be working with equations of lines in various different forms. Since the laws of geometry remain somewhat constant, similar to the last lesson when parallel and perpendicular lines were discussed, parallel lines share the same slope, and the slope of perpendicular lines is the negative inverse of the original slope (in other words, flip the sign and flip the fraction). To find lines parallel or perpendicular to those represented in equations, finding the slope of the equation you are given is going to be necessary. This is can be very simple depending on what form the equation is written in. y=mx+b (Slope-Line Intercept Form) This form has a pretty big advantage over the other ones in that you are given the slope in the original equation itself, making it remarkably easy to find the slopes of parallel and perpendicular lines. Ax+By=C (Standard Form) This from is one of the more complex ones. There are two ways to go about getting the slope of this equation. The first is to just memorize the formula for slope when using standard form (m= - A/B). The other way is to rearrange the equation using algebra. This can be done several different ways depending on how you prefer to do algebra. However, if you do plan on using this method, make sure to remove all fractions by multiplying by the lowest common multiple of the denominators before rearranging the equation. y − y₁ = m(x − x₁) (Point-Slope form) Similar to the first form, the slope of equations in standard form is also displayed in the original equation. I don’t recommend using algebra to turn equations into this from however as it is much more complex than slope-line intercept form. In lesson 5.1, we learned about different forms for the equation of a line. Here is Slope-Intercept form. First, let's talk about what Slope-Intercept form is. It's the equation of a line in the format y = mx + b. In this equation, m, the co-efficient of x, is the slope of the line, and b, the constant, is the y-intercept (0, y). This format is very useful to instantly graph the equation, because you already know the y-intercept and the slope. Plot the y-intercept and find another point using the slope*, and then draw a line through those two points. For example, let's try the line y = 3x + 2. The y-intercept is (0, 2) and the slope is 3, or 3/1. If there is no constant, then the y-intercept is (0, 0). Remember, y = 3x is the same as y = 3x + 0 Similarly with the co-efficient of x, if there is none, then the slope is 1. y = x + 2 is the same as y = 1x + 2 *If the point you would graph based on the y-intercept and slope is not on your grid, then just remember that you can go in the opposite direction! ex: 3/2 = -3/-2. If you are given the y-intercept (0, y) of a line and its slope, you can reverse-engineer that information into Slope-Intercept form without having to graph the line. For example, if you are given the y-intercept (0, -3) and the slope 1/2, you can put those directly into your format of y = mx + b, and turn it into y = 1/2x - 3. Finally, let's talk about the big gross elephant in the room, "Standard Form". Standard form is written as Ax + By = C. If you ever come across something in this form, I suggest you use algebra to turn it into Slope-Intercept form so that it is more clearly understandable, but otherwise, let's learn how this format works. In Standard Form, A, B, and C must all be integers, and A must be positive. To convert fractions into integers, multiply the whole equation by the LCM of all of the denominators. Now, there are still shortcuts to find the slope and y-intercept. In Standard form, slope = -A/B In Standard form, y-intercept = (0, C/B) So if you have 3x - 2y = 4, your shortcut to the slope is -3/-2 (3/2), and your y-intercept is (0, 4/2) or (0, 2) 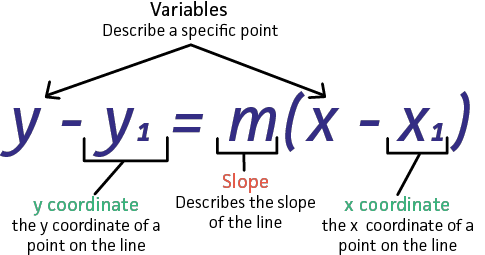 Hey people Katja here. The video and I are going to explain point-slope form. This is the equation: The 2 coordinates make the point: (x₁, y₁) (x₁, y₁) can be any point on the line Let’s say our: point = (4, -1) (x₁, y₁) Slope (m) = 3 1st step: substitute the given point into the equation Criss cross applesauce the coordinates in. 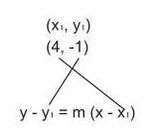 y - (-1)= m (x - (+4)) 2nd step: Our signs need to switch The sign will always be opposite: + → - - - → + so: 4 → -4 -1→ 1 y - (-1)= m (x - (+4)) y + 1 = m (x - 4) 3rd step: Substitute slope value into the equation and get rid of the brackets m (slope)= 3 y + 1 = m (x - 4) y + 1 = 3x - 4 Ok we’re done! You can use algebra to write this in standard form and slope intercept form. Hopefully you understood this and thanks for reading! Hey, its Lilly and I'm going to talk about special cases of linear equations, which from what I understand involves writing the equations for vertical and horizontal lines, writing the equation of a line from two points and determining whether equations are perpendicular or horizontal. To start off with, horizontal equations. These are pretty easy, the formula in slope intercept form is x=k. The y value is not necessary because y could be any real number therefor irrelevant. Secondly vertical equations. The formula for these in slope intercept form is x=k. As they are opposite to horizontal equations, the x value doesn't need specification as it could also be any real number. When writing an equation from two points it is good to first determine slope, by putting delta y over delta x, then arranging one of the points into the equation along with the slope in the form of a slope point equation. Once this has been achieved the equation can be graphed or be put into another form of equation algebraically. The last thing we covered today was determining whether equations are are perpendicular, horizontal or neither. In order to determine this just find the slope of the two equations the if they are the same then the equations are parallel, if they are the opposite sign reciprocal then they are perpendicular and if they are neither then they are neither. 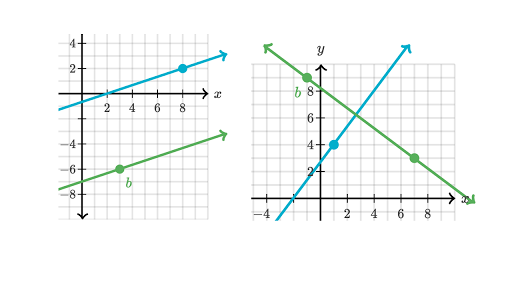 Hi today i'l be explaining Parallel and perpendicular lines. Parallel lines are lines in a coordinate system that never intersect. Because they rise and fall at the same rate, they have the same slopes. The image on the left is a example of this. Perpendicular lines are lines that form right angles with each other when they intersect. The product of the slopes of perpendicular lines is always -1. Another way to tell if two lines are perpendicular: if the slope of one is a/b, then the slope f the other line will be -b/a. The image on the right is an example of this. If you have on line, to find its perpendicular other line, all that must be done is to find its reciprocal, then make that a negative. for example, 2, and -1/2 and perpendicular to each other. -Ben T. hey theydies! your local soup lover here today to summarize how to graph linear equations xx there are three main ways to solve/graph linear functions: by creating a graph or using the slope formula (the x points subtracted over the y points subtracted, y'all know what I mean I just don't know how to put that formula in here lol I'm inept at computers). With the slope formula, you are able to find the slope of the line with two given points or find a second point in a line when provided with the slope and a singular point. when you use the actual grid method, you create the grid, plot the point provided (if you're lucky enough to know one) and then follow the slope formula, rise over run, to create your slope triangle. once you have that second plotted point, you can connect the two points with a line, add some arrows and !! u got yourself a line wowie the formula option is arguably faster and according to mrs bjornson, you wanna have this one down pat for senior math classes! with this one, you put your x's above your y's, subtract 'em, and then bam!! your slope!! also! don't forget that if your slope has a negative sign at the centre of the fraction, just assign it to either the numerator or the denominator. it doesn't matter which one! isn't that nice for once. another time its easy to determine the slope is when you're given an x and y intercept! using this information, you can use your preferred method to find the slope. also remember that if your slope is undefined, its just a vertical line! and if your slope is 0, its just a horizontal line! sneaky aren't they now. heres someone summarizing everything I just attempted to explain but doing it significantly better: thanks for reading and I hope I didn't do too terrible of a job!!
xoxo Caitlin So apparently this didnt post the first time. YAY. A non-linear equation is an equation (y = x+2) that is not a line (its not straight). What this means is that the equation is to a degree THAT IS NOT ONE. Pretty much. If it has a degree or 2, it will make a parabola; if it has a degree of 3 it will be a fat fat S. The higher the degree the fatter it will get. There are some tips I have for you to not screw up graphing non-linear equations: - use as many integers as possible - if the value is to an even power (y = x^16) use both positive and negative values - use values between 0-1 when the x is in the denominator or the exponent (y = 5/x or y = 5^x) - use enough points to understand what's going on A very common question you will find is 'is this a function?'. you have a 50% chance of guessing right so do your best. ok but actually just graph it out and do a verticle line test (fun fact: if the y is to an even power it's not a function.) :) here's some fun videos:: https://www.youtube.com/watch?v=CYBKdCvwCQI you're welcome sofia
before we get into let me just say that I was originally written to do chapter 3.3 but because I missed that lesson i switched with Sofia and covered 3.4. fun news, she forgot. so now we have two of these and none of those. good luck. Graphing Non-Linear Equations because thats all the chapter is about:REMEMBER WHEN GRAPHING THEM TO USE A WIDE RANGE OF INPUTS Basically, just make a table chart thing and chose some values. Is it a function? Guess. Or don't I really don’t care. Just graph it a v-line it and then yeah that's basically it. FUN HINT if y is to an even power its not a function because there's gonna be multiple potential y values for every x. Examples: x = y2 Because y is the one with the fanciness we’re gonna pump some values into that. Let's use -2, -1, 0, 1, and 2, because they’re useful and its what the textbook shows. 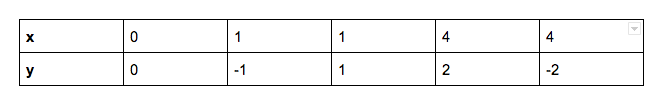 And that makes a fun thing that kinda looks like this: 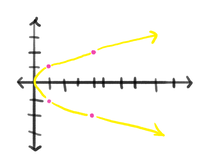 Which ain’t a function because it double v What about y = x2 - 1? Well it’s the x with the fancy dancy so lets do them first. 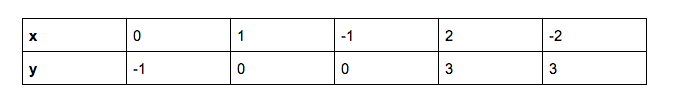 Which does a this: 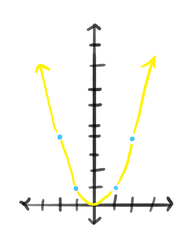 And, fun fact, its a function Last example: x2 + y2 = 9 So for this one ya just kinda need to understand but im not too sure how testy this will be. SO because both x and y are to even powers they both could be positive or negative. Basically you algerebra it and stuff but thats not shown in the book so imma not. The table is there buts it's confusing so instead heres just the graph 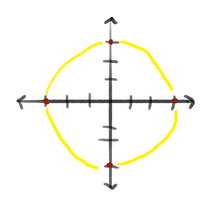 Its a cricle! Why? Well, remember when just x was squared and it created a half-circle curve and when just y was squared it made another half-circle curve but the other way? Well this basically closes the circle by overlaying the stuff. Cool. Also its not a function. Voila. And now I shall depart and curse my sister for our terrible communication. I really dont want to do another of these. Astrid ps heres a digitalized version of what i drew on my notes  |
Find your green dot!AuthorsWe are members of Esquimalt High School's Gifted Math 10 class. Most of us like Hi-Chews. Archives
June 2019
Categories
All
|
 RSS Feed
Photo used under Creative Commons from Free Public Domain Illustrations by rawpixel
